Zip Code 10177 - New York City
| Primary City | New York City |
| Area of Zip Code 10177 | 29,162 sq ft |
| Population | 2,971 |
| Male Population | 1,463 (49.2%) |
| Female Population | 1,508 (50.8%) |
| Median Age | 36.3 years |
| Male Median Age | 37.6 years |
| Female Median Age | 35 years |
| Area Codes | 203, 212, 315, 347, More |
| Neighborhoods | Manhattan |
| Timezone | Eastern Daylight Time |
| Coordinates | 40.754985000000005° / -73.97589166666666° |
| Related Zip Codes | 10167, 10170, 10171, 10172, 10173, 10174, 10175, 10176, 10178, 10179 |
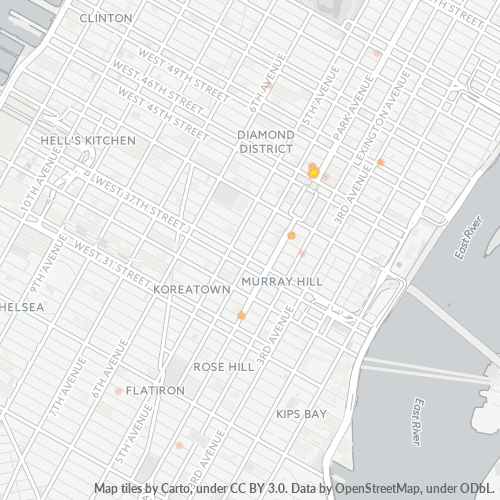
Map of Zip Code 10177 - New York City
Interactive Map
Zip Code 10177 - New York City Population
Years 1975 to 2030
| Data | 1975 | 1990 | 2000 | 2015 | 2020 | 2025* | 2030* |
|---|---|---|---|---|---|---|---|
| Population | 0 | 0 | 0 | 0 | 2,971 | 3,094 | 3,176 |
| Population Density | 0 / km² | 0 / km² | 0 / km² | 0 / km² | 1,096,621.3 / km² | 1,142,021.7 / km² | 1,172,288.6 / km² |
Zip Code 10177 - New York City Population change from 2000 to 2020
| Location | Change since 1975 | Change since 1990 | Change since 2000 |
|---|---|---|---|
| Zip Code 10177 - New York City | — | — | — |
| New York | +18.6% | +4.9% | +3.1% |
| New York | +17.8% | +9.5% | +3.9% |
| United States | — | — | — |
Zip Code 10177 - New York City Median Age
Median Age: 36.3 years
| Location | Median Age | Median Age (Female) | Median Age (Male) |
|---|---|---|---|
| Zip Code 10177 - New York City | 36.3 yrs | 35 yrs | 37.6 yrs |
| New York | 35.5 yrs | 36.8 yrs | 34.1 yrs |
| New York | 38.1 yrs | 39.6 yrs | 36.6 yrs |
| United States | 37.4 yrs | 38.7 yrs | 36.1 yrs |
Zip Code 10177 Population Density
Population Density: 2,840,237 / mi²
| Location | Population | Area | Density |
|---|---|---|---|
| Zip Code 10177 | 2,971 | 29,162 sq ft | 2,840,237 / mi² |
| New York City | 8.2 million | 302.8 sq mi | 27,216 / mi² |
| New York | 19.8 million | 54,555 sq mi | 363 / mi² |
| United States | 321.6 million | 3,796,740.8 sq mi | 84.7 / mi² |
Zip Code 10177 - New York City Historical and Projected Population
Estimated Population from 1930 to 2100
- JRC (European Commission's Joint Research Centre) work on the GHS built-up grid
- CIESIN (Center for International Earth Science Information Network)
- [Link] Klein Goldewijk, K., Beusen, A., Doelman, J., and Stehfest, E.: Anthropogenic land use estimates for the Holocene – HYDE 3.2, Earth Syst. Sci. Data, 9, 927–953, https://doi.org/10.5194/essd-9-927-2017, 2017.
| Population | 2,971 |
| Households in Zip Code 10177 - New York City | 0 |
Industries
Business Distribution by Industry in Zip Code 10177 - New York City
| Industry Description | Number of Establishments | Average Age of Business |
|---|---|---|
| Corporate management | 21 | 38.3 years |
| Electronics stores | 13 | 22.5 years |
| Finance other | 21 | 24.5 years |
| Financial services | 24 | 32 years |
| Lawyers legal | 517 | 26.7 years |
| Legal and financial | 11 | — |
| Real estate | 19 | 45.7 years |
Human Development Index (HDI)
Statistic composite index of life expectancy, education, and per capita income.
Zip Code 10177 CO2 Emissions
Carbon Dioxide (CO2) Emissions Per Capita in Tonnes Per Year
| Location | CO2 Emissions | CO2 Emissions Per Capita | CO2 Emissions Intensity |
|---|---|---|---|
| Zip Code 10177 | 53,837 tn | 18.12 tn | 51,467,538.5 tons/mi² |
| New York City | 105,777,963 tn | 12.83 tn | 349,298 tons/mi² |
| New York | 341,791,877 tn | 17.25 tn | 6,265.1 tons/mi² |
| United States | 5,664,619,810 tn | 17.62 tn | 1,492 tons/mi² |
| 2013 CO2 emissions (tonnes/year) | 53,837 tn |
| 2013 CO2 emissions (tonnes/year) per capita | 18.12 tn |
| 2013 CO2 emissions intensity (tonnes/mi²/year) | 51,467,538.5 tons/mi² |
Natural Hazards Risk
Relative risk out of 10
| Hazard | Risk Level |
|---|---|
| Flood | Medium (4) |
| Earthquake | Low (2) |
| Cyclone | High (8) |
Recent Nearby Earthquakes
Magnitude 3.0 and greater
| Date▼ | Time↕ | Magnitude↕ | Distance↕ | Depth↕ | Location↕ | Link |
|---|---|---|---|---|---|---|
| 8/26/03 | 11:24 AM | 3.1 | 96.9 km | 2,910 m | New Jersey | usgs.gov |
| 1/9/92 | 12:50 AM | 3.1 | 53.4 km | 7,900 m | New Jersey | usgs.gov |
| 10/19/85 | 3:07 AM | 3.6 | 27.9 km | 6,000 m | New York | usgs.gov |
| 3/9/79 | 8:49 PM | 3.1 | 44.8 km | 3,000 m | New Jersey | usgs.gov |
| 1/30/79 | 8:30 AM | 3.5 | 54 km | 5,000 m | New Jersey | usgs.gov |
| 4/13/76 | 7:39 AM | 3.1 | 6.8 km | — | Greater New York area, New Jersey | usgs.gov |
| 6/7/74 | 12:45 PM | 3.3 | 90.7 km | 2,000 m | New York | usgs.gov |
| 3/23/57 | 11:02 AM | 3.8 | 71.8 km | 10,000 m | New Jersey | usgs.gov |
| 9/1/95 | 3:09 AM | 4.1 | 44.3 km | — | New Jersey | usgs.gov |
| 8/10/84 | 11:07 AM | 5.5 | 17.3 km | — | New York | usgs.gov |
Primary City
New York—often called New York City or the City of New York to distinguish it from the State of New York, of which it is a part—is the most populous city in the United States and the center of the New York metropolitan area, the premier gateway for l..
New York City Wikipedia Page
About Our Data
The data on this page is estimated using a number of publicly available tools and resources. It is provided without warranty, and could contain inaccuracies. Use at your own risk.