Zip Code 61853 - Illinois
Illinois | United States
| Area of Zip Code 61853 | 48.81 sq mi |
| Population | 12,553 |
| Male Population | 6,194 (49.3%) |
| Female Population | 6,359 (50.7%) |
| Population change from 1975 to 2020 | +50.7% |
| Population change from 2000 to 2020 | +5.9% |
| Median Age | 37.6 years |
| Male Median Age | 37.1 years |
| Female Median Age | 38.1 years |
| Neighborhoods | Mahomet |
| Timezone | Central Daylight Time |
| Coordinates | 40.22145654549074° / -88.41678504874031° |
| Related Zip Codes | 61843, 61850, 61851, 61852, 61854, 61855, 61856, 61857, 61858, 61859 |
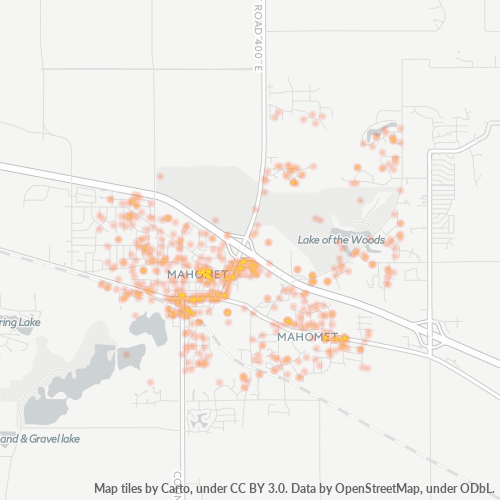
Map of Zip Code 61853 - Illinois
Interactive Map
Zip Code 61853 - Illinois Population
Years 1975 to 2030
| Data | 1975 | 1990 | 2000 | 2015 | 2020 | 2025* | 2030* |
|---|---|---|---|---|---|---|---|
| Population | 8,330 | 10,326 | 11,851 | 13,852 | 12,553 | 12,445 | 11,704 |
| Population Density | 65.9 / km² | 81.7 / km² | 93.7 / km² | 109.6 / km² | 99.3 / km² | 98.4 / km² | 92.6 / km² |
* Projected
Sources: JRC (European Commission's Joint Research Centre) work on the GHS built-up gridRacial demographics for Zip Code 61853 - Illinois
Zip Code 61853 - Illinois Population change from 2000 to 2020
Increase of 5.9% from year 2000 to 2020
| Location | Change since 1975 | Change since 1990 | Change since 2000 |
|---|---|---|---|
| Zip Code 61853 - Illinois | +50.7% | +21.6% | +5.9% |
| Illinois | +16.2% | +9.2% | +3.4% |
| United States | — | — | — |
Sources: JRC (European Commission's Joint Research Centre) work on the GHS built-up grid
Zip Code 61853 - Illinois Median Age
Median Age: 37.6 years
| Location | Median Age | Median Age (Female) | Median Age (Male) |
|---|---|---|---|
| Zip Code 61853 - Illinois | 37.6 yrs | 38.1 yrs | 37.1 yrs |
| Illinois | 36.6 yrs | 37.9 yrs | 35.3 yrs |
| United States | 37.4 yrs | 38.7 yrs | 36.1 yrs |
Sources: CIESIN (Center for International Earth Science Information Network)
Zip Code 61853 Population Density
Population Density: 257 / mi²
| Location | Population | Area | Density |
|---|---|---|---|
| Zip Code 61853 | 12,553 | 48.81 sq mi | 257 / mi² |
| Illinois | 12.9 million | 57,913.5 sq mi | 223 / mi² |
| United States | 321.6 million | 3,796,740.8 sq mi | 84.7 / mi² |
Sources: JRC (European Commission's Joint Research Centre) work on the GHS built-up grid
Zip Code 61853 - Illinois Historical and Projected Population
Estimated Population from 1840 to 2100
Sources:
- JRC (European Commission's Joint Research Centre) work on the GHS built-up grid
- CIESIN (Center for International Earth Science Information Network)
- [Link] Klein Goldewijk, K., Beusen, A., Doelman, J., and Stehfest, E.: Anthropogenic land use estimates for the Holocene – HYDE 3.2, Earth Syst. Sci. Data, 9, 927–953, https://doi.org/10.5194/essd-9-927-2017, 2017.
Stats and Demographics for Zip Code 61853 - Illinois
| Population | 12,553 |
| Households in Zip Code 61853 - Illinois | 3,884 |
| People per Household | 2.85 |
| Average House Value | $115,400 |
| Income per Household | $55,000 |
Business Concentration in Zip Code 61853 - Illinois
Industries
Business Distribution by Industry in Zip Code 61853 - Illinois
| Industry Description | Number of Establishments | Average Age of Business |
|---|---|---|
| Atm's | 30 | — |
| Car repair | 12 | 26.6 years |
| Construction of buildings | 16 | 28.5 years |
| Dentists | 34 | 27.2 years |
| General contractors | 42 | 24.6 years |
| Pharmacies and drug stores | 2 | — |
| Physicians and surgeons | 14 | — |
| Public parks | 19 | — |
| Religion | 1 | 50.1 years |
| Restaurants | 15 | 30.3 years |
| Shopping | 7 | 25.7 years |
| Businesses | 3,622 |
| Estimated total revenue | ~$426.7M |
| Median revenue per business | ~$431.0K |
| Estimated jobs | 2,739 |
| Estimated payroll | ~$108.5M |
| Industries | Businesses | Total revenue | Median | Jobs |
|---|---|---|---|---|
| Wholesale and retail trade; repair of motor vehicles and motorcycles | 268 | ~$192.6M | ~$559.2K | 381 |
| Human health and social work activities | 183 | ~$35.1M | ~$578.3K | 317 |
| Professional, scientific and technical activities | 218 | ~$28.1M | ~$558.3K | 128 |
| Real estate activities | 77 | ~$26.2M | ~$736.8K | 70 |
| Construction | 176 | ~$24.7M | ~$514.4K | 122 |
| Education | 46 | ~$24.3M | ~$327.8K | 286 |
| Other service activities | 185 | ~$23.8M | ~$233.9K | 221 |
| Arts, entertainment and recreation | 178 | ~$19.1M | ~$362.1K | 172 |
Largest businesses by estimated revenue
- Circle K | Truck Stop — Mahomet, Illinois · ~$57.2M
- P&P Heating & Cooling — Mahomet, Illinois · ~$21.7M
- Mahomet Car Connection — Mahomet, Illinois · ~$9.2M
- Stevens Jeff Farm ll — Mahomet, Illinois · ~$9.0M
- Primo Water Refill — Mahomet, Illinois · ~$7.8M
median from the 505 of 3,622 businesses with estimates Estimate based on strong signals
Zip Code 61853 - Illinois — Revenue trend
Median business revenue by year
| Year | 2019 | 2020 | 2021 | 2022 | 2023 | 2024 |
|---|---|---|---|---|---|---|
| Median revenue per business | ~$296.4K | ~$297.5K | ~$329.6K | ~$388.8K | ~$424.4K | ~$424.4K |
Revenue modeled for the same 502 businesses across all years. Estimate based on strong signals
Business distribution by price for Zip Code 61853 - Illinois
Human Development Index (HDI)
Statistic composite index of life expectancy, education, and per capita income.
Source: [Link] Kummu, M., Taka, M. &Guillaume, J. Gridded global datasets for Gross Domestic Product and Human Development Index over 1990–2015. Sci Data 5, 180004 (2018) doi:10.1038/sdata.2018.4
Zip Code 61853 - Illinois Gross Domestic Product (GDP)
GDP per capita, PPP (constant 2017 international $)
| Data | 1990 | 1995 | 2000 | 2005 | 2010 | 2015 | 2020 | 2022 |
|---|---|---|---|---|---|---|---|---|
| GDP per capita | $40,458 | $41,104 | $47,811 | $53,391 | $55,056 | $60,236 | $56,457 | $62,187 |
| Total GDP | $411.2M | $433.2M | $507.7M | $599.7M | $656.8M | $723.3M | $637.4M | $699.8M |
Source: [Link] Kummu, M., Kosonen, M. & Masoumzadeh Sayyar, S. Downscaled gridded global dataset for gross domestic product (GDP) per capita PPP over 1990–2022. Sci Data 12, 178 (2025) doi:10.1038/s41597-025-04487-x
Zip Code 61853 CO2 Emissions
Carbon Dioxide (CO2) Emissions Per Capita in Tonnes Per Year
| Location | CO2 Emissions | CO2 Emissions Per Capita | CO2 Emissions Intensity |
|---|---|---|---|
| Zip Code 61853 | 251,987 tn | 20.07 tn | 5,162.7 tons/mi² |
| Illinois | 258,230,858 tn | 20 tn | 4,458.9 tons/mi² |
| United States | 5,664,619,810 tn | 17.62 tn | 1,492 tons/mi² |
Sources: [Link] Moran, D., Kanemoto K; Jiborn, M., Wood, R., Többen, J., and Seto, K.C. (2018) Carbon footprints of 13,000 cities. Environmental Research Letters DOI: 10.1088/1748-9326/aac72a
Zip Code 61853 CO2 Emissions
| 2013 CO2 emissions (tonnes/year) | 251,987 tn |
| 2013 CO2 emissions (tonnes/year) per capita | 20.07 tn |
| 2013 CO2 emissions intensity (tonnes/mi²/year) | 5,162.7 tons/mi² |
Natural Hazards Risk
Relative risk out of 10
| Hazard | Risk Level |
|---|---|
| Flood | Medium (7) |
* Risk, particularly concerning flood or landslide, may not be for the entire area.
About Our Data
The data on this page is estimated using a number of publicly available tools and resources. It is provided without warranty, and could contain inaccuracies. Use at your own risk.