Zip Code 79936 - El Paso, Texas
| Primary City | El Paso, Texas |
| Area of Zip Code 79936 | 26.65 sq mi |
| Population | 133,891 |
| Male Population | 64,150 (47.9%) |
| Female Population | 69,741 (52.1%) |
| Population change from 1975 to 2020 | +128.8% |
| Population change from 2000 to 2020 | +40.9% |
| Median Age | 31 years |
| Male Median Age | 28.8 years |
| Female Median Age | 33 years |
| Area Codes | 915 |
| Neighborhoods | Americas, Glen Cove, Las Palmas, Marty Robbins North, Marty Robbins South, Montwood, O'Shea Keleher, Quail Run, Sandy Creek, Stone Ridge, Vista Del Sol, Vista del Sol East, Vista Hills, Vista Hills Park |
| Timezone | Mountain Daylight Time |
| Coordinates | 31.776190884819822° / -106.29785737320474° |
| Related Zip Codes | 79925, 79926, 79927, 79930, 79931, 79932, 79934, 79935, 79937, 79938 |
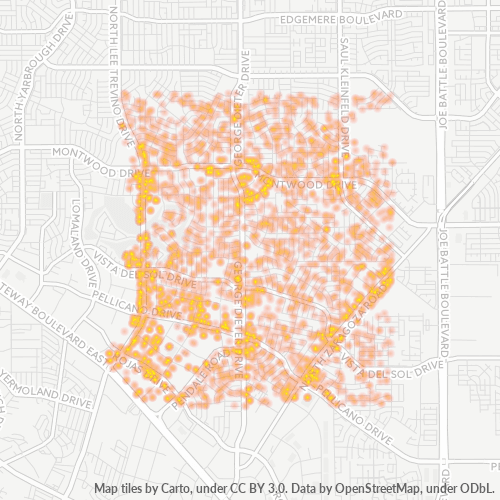
Map of Zip Code 79936 - El Paso, Texas
Interactive Map
Zip Code 79936 - El Paso, Texas Population
Years 1975 to 2030
| Data | 1975 | 1990 | 2000 | 2015 | 2020 | 2025* | 2030* |
|---|---|---|---|---|---|---|---|
| Population | 58,529 | 78,181 | 95,006 | 119,807 | 133,891 | 139,707 | 145,284 |
| Population Density | 848.1 / km² | 1,132.8 / km² | 1,376.6 / km² | 1,736 / km² | 1,940 / km² | 2,024.3 / km² | 2,105.1 / km² |
Racial demographics for Zip Code 79936 - El Paso, Texas
Zip Code 79936 - El Paso, Texas Population change from 2000 to 2020
Increase of 40.9% from year 2000 to 2020
| Location | Change since 1975 | Change since 1990 | Change since 2000 |
|---|---|---|---|
| Zip Code 79936 - El Paso, Texas | +128.8% | +71.3% | +40.9% |
| El Paso | +160.6% | +84.9% | +38.7% |
| Texas | +128.3% | +74% | +42% |
| United States | — | — | — |
Zip Code 79936 - El Paso, Texas Median Age
Median Age: 31 years
| Location | Median Age | Median Age (Female) | Median Age (Male) |
|---|---|---|---|
| Zip Code 79936 - El Paso, Texas | 31 yrs | 33 yrs | 28.8 yrs |
| El Paso | 32.4 yrs | 34.4 yrs | 30.3 yrs |
| Texas | 33.8 yrs | 34.8 yrs | 32.8 yrs |
| United States | 37.4 yrs | 38.7 yrs | 36.1 yrs |
Zip Code 79936 Population Density
Population Density: 5,025 / mi²
| Location | Population | Area | Density |
|---|---|---|---|
| Zip Code 79936 | 133,891 | 26.65 sq mi | 5,025 / mi² |
| El Paso, Texas | 765,324 | 256.3 sq mi | 2,987 / mi² |
| Texas | 29.8 million | 268,596.2 sq mi | 111 / mi² |
| United States | 321.6 million | 3,796,740.8 sq mi | 84.7 / mi² |
Zip Code 79936 - El Paso, Texas Historical and Projected Population
Estimated Population from 1880 to 2100
- JRC (European Commission's Joint Research Centre) work on the GHS built-up grid
- CIESIN (Center for International Earth Science Information Network)
- [Link] Klein Goldewijk, K., Beusen, A., Doelman, J., and Stehfest, E.: Anthropogenic land use estimates for the Holocene – HYDE 3.2, Earth Syst. Sci. Data, 9, 927–953, https://doi.org/10.5194/essd-9-927-2017, 2017.
Neighborhoods
Business Distribution by neighborhood in Zip Code 79936 - El Paso, Texas
| Population | 133,891 |
| Households in Zip Code 79936 - El Paso, Texas | 28,236 |
| People per Household | 3.41 |
| Average House Value | $77,400 |
| Income per Household | $42,857 |
Industries
Business Distribution by Industry in Zip Code 79936 - El Paso, Texas
| Industry Description | Number of Establishments | Average Age of Business |
|---|---|---|
| Beauty salons | 170 | 19.2 years |
| Car repair | 196 | 27 years |
| Construction of buildings | 229 | 24.7 years |
| Corporate management | 191 | 21.5 years |
| Dentists | 294 | 24.9 years |
| Electronics stores | 201 | 23.4 years |
| Finance other | 173 | 46.5 years |
| Financial services | 226 | 25.6 years |
| Freight/commercial transport | 159 | 24.5 years |
| Hairdressers | 157 | 21.7 years |
| Health and medical | 649 | 25.7 years |
| Legal and financial | 536 | 28.7 years |
| Physicians and surgeons | 166 | 29.6 years |
| Real estate | 372 | 25.9 years |
| Restaurants | 636 | 25 years |
| Shopping | 332 | 30 years |
Business distribution by price for Zip Code 79936 - El Paso, Texas
Human Development Index (HDI)
Statistic composite index of life expectancy, education, and per capita income.
Zip Code 79936 - El Paso, Texas Gross Domestic Product (GDP)
GDP per capita, PPP (constant 2017 international $)
| Data | 1990 | 1995 | 2000 | 2005 | 2010 | 2015 | 2020 | 2022 |
|---|---|---|---|---|---|---|---|---|
| GDP per capita | $24,839 | $26,183 | $29,711 | $33,867 | $34,548 | $37,746 | $38,190 | $40,407 |
| Total GDP | $1.5B | $1.8B | $2.2B | $2.7B | $3B | $3.6B | $3.9B | $4.2B |
Zip Code 79936 CO2 Emissions
Carbon Dioxide (CO2) Emissions Per Capita in Tonnes Per Year
| Location | CO2 Emissions | CO2 Emissions Per Capita | CO2 Emissions Intensity |
|---|---|---|---|
| Zip Code 79936 | 1,880,109 tn | 14.04 tn | 70,556.3 tons/mi² |
| El Paso, Texas | 11,267,451 tn | 14.72 tn | 43,969.9 tons/mi² |
| Texas | 528,965,405 tn | 17.76 tn | 1,969.4 tons/mi² |
| United States | 5,664,619,810 tn | 17.62 tn | 1,492 tons/mi² |
| 2013 CO2 emissions (tonnes/year) | 1,880,109 tn |
| 2013 CO2 emissions (tonnes/year) per capita | 14.04 tn |
| 2013 CO2 emissions intensity (tonnes/mi²/year) | 70,556.3 tons/mi² |
Natural Hazards Risk
Relative risk out of 10
| Hazard | Risk Level |
|---|---|
| Drought | High (8) |
Recent Nearby Earthquakes
Magnitude 3.0 and greater
| Date▼ | Time↕ | Magnitude↕ | Distance↕ | Depth↕ | Location↕ | Link |
|---|---|---|---|---|---|---|
| 1/4/77 | 10:31 AM | 3.2 | 87.7 km | 5,000 m | New Mexico | usgs.gov |
Primary City
El Paso (/ɛlˈpæsoʊ/; from Spanish, "the pass") is the county seat of El Paso County, Texas, United States, and lies in far West Texas. In 1659, Fray Garcia de San Francisco, established Our Lady of Guadalupe Mission of El Paso del Norte. Around this ..
El Paso, Texas Wikipedia Page
About Our Data
The data on this page is estimated using a number of publicly available tools and resources. It is provided without warranty, and could contain inaccuracies. Use at your own risk.